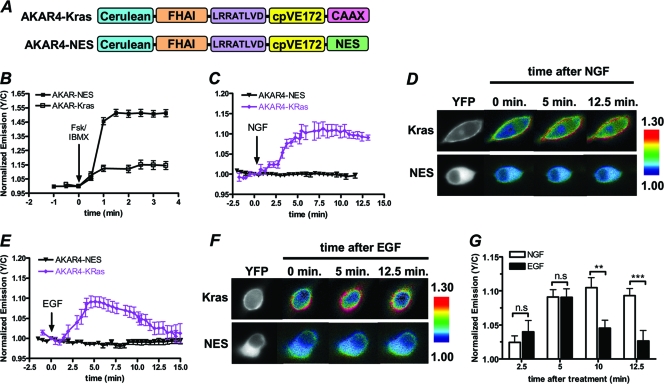
Fig. 1.
GF-induced PKA activity is spatiotemporally regulated in PC12 cells. (A) Schematic representation of AKAR4-Kras and AKAR4-NES. (B) PC12 cells expressing AKAR4-NES (n = 3) or AKAR4-Kras (n = 6) were treated with Fsk (50 μM) plus IBMX (100 μM). Y/C, yellow/cyan emission ratio. (C) Time courses depicting the NGF (200 ng/ml)-induced responses of AKAR4-Kras (n = 5) and AKAR4-NES (n = 5). (D) YFP images and ratiometric images of AKAR4-Kras (top) and AKAR4-NES (bottom) before NGF addition (0 min) and at 5 min and 12.5 min after NGF addition. (E) Time courses depicting the EGF (100 ng/ml)-induced responses of AKAR4-Kras (n = 6) and AKAR4-NES (n = 3). (F) YFP images and ratiometric images of AKAR4-Kras (top) and AKAR4-NES (bottom) before EGF addition (0 min) and at 5 min and 12.5 min after EGF addition. (G) Bar graph depicting the AKAR4-Kras responses at 2.5, 5, 10, and 12.5 min following NGF (n = 11) or EGF (n = 12) treatment. n.s, no statistically significant difference between indicated treatments; **, P ≤ 0.01; ***, P ≤ 0.005. All data are shown as means ± SEMs.

