
Fig. 2.
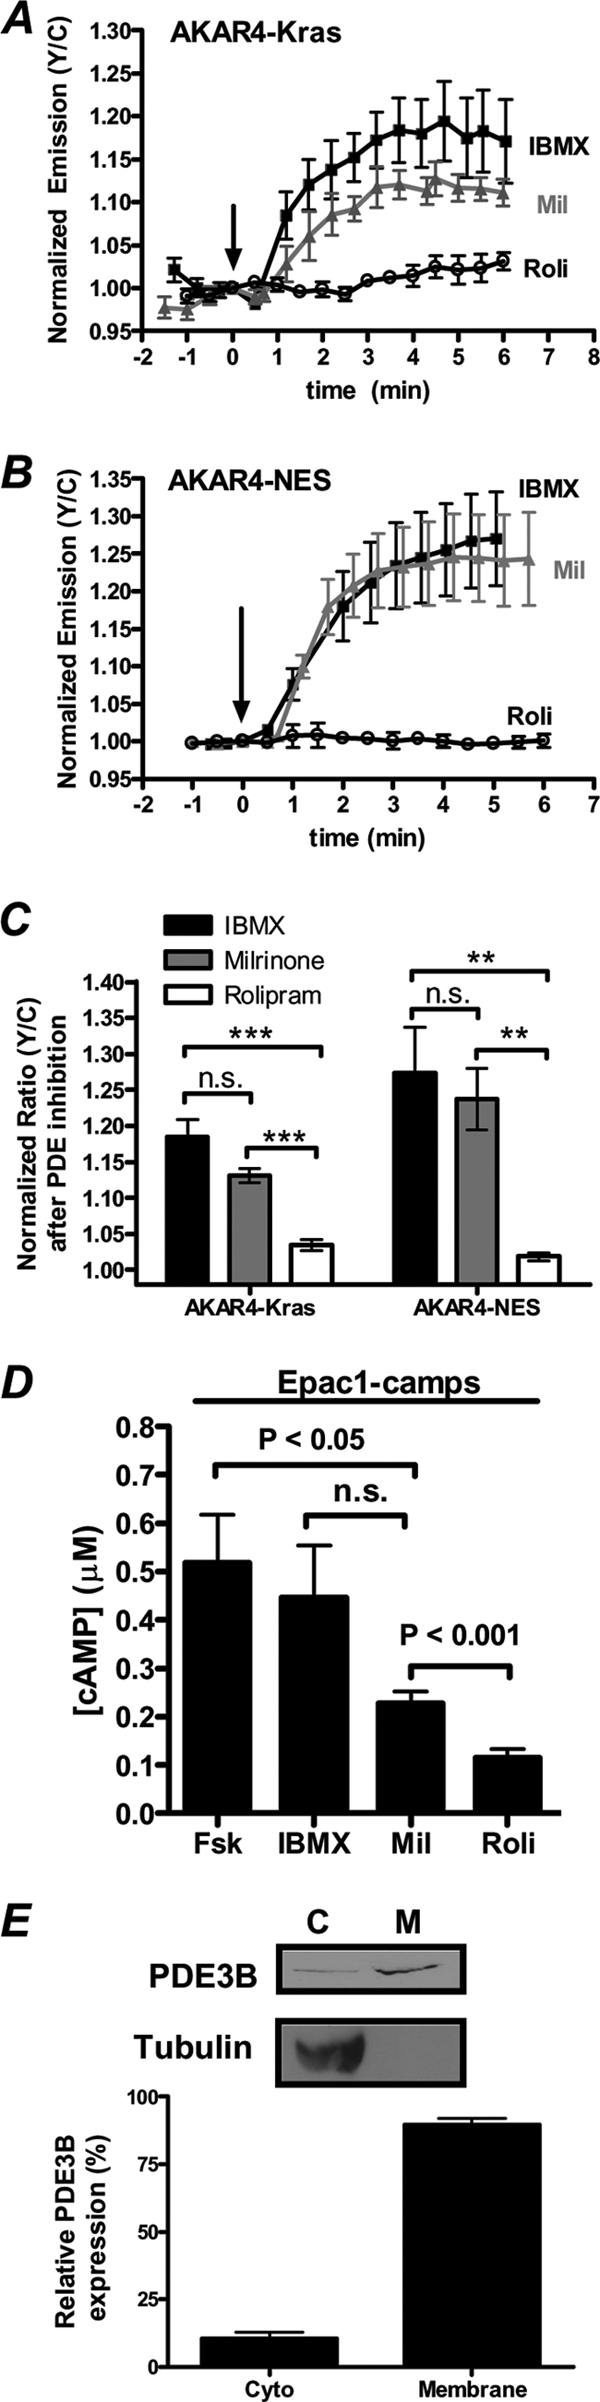
PDE3, but not PDE4, regulates both PM and cytosolic PKA activity in PC12 cells. (A) PC12 cells expressing AKAR4-Kras were treated with 100 μM IBMX (n = 4), 10 μM milrinone (Mil) (n = 5), or 1 μM rolipram (Roli) (open circles; n = 5), and PKA activity was monitored. (B) Cytosolic PKA activity was detected in cells expressing AKAR4-NES treated with 100 μM IBMX (n = 4), 10 μM Mil (n = 5), or 1 μM Roli (n = 6). (C) Responses of AKAR4-Kras and AKAR4-NES induced by IBMX (Kras [n = 13], NES [n = 9]), Mil (Kras [n = 16], NES [n = 7]), and Roli (Kras [n = 9], NES [n = 15]). (D) Bar graph depicting the cAMP concentration ([cAMP]) induced by various treatments, as determined by Epac1-camps [50 nM Fsk (n = 11), 100 μM IBMX (n = 8), 10 μM Mil (n = 15), 1 μM Roli (n = 11)]. (E) PC12 cells were separated into cytosolic (C) and membrane (M) fractions by centrifugation, and each fraction was separated by SDS-PAGE. Immunoblot analysis (top) is representative of one fractionation, and quantification of the relative expression of PDE3B in each fraction (bottom) is representative of four independent fractionation experiments and subsequent immunoblot analysis. Tubulin serves as a control for clean separation of the membrane and cytosolic fractions. All data are presented as means ± SEMs; “n.s.” indicates no statistically significant difference between indicated treatments. **, P < 0.01; ***, P < 1E−05.