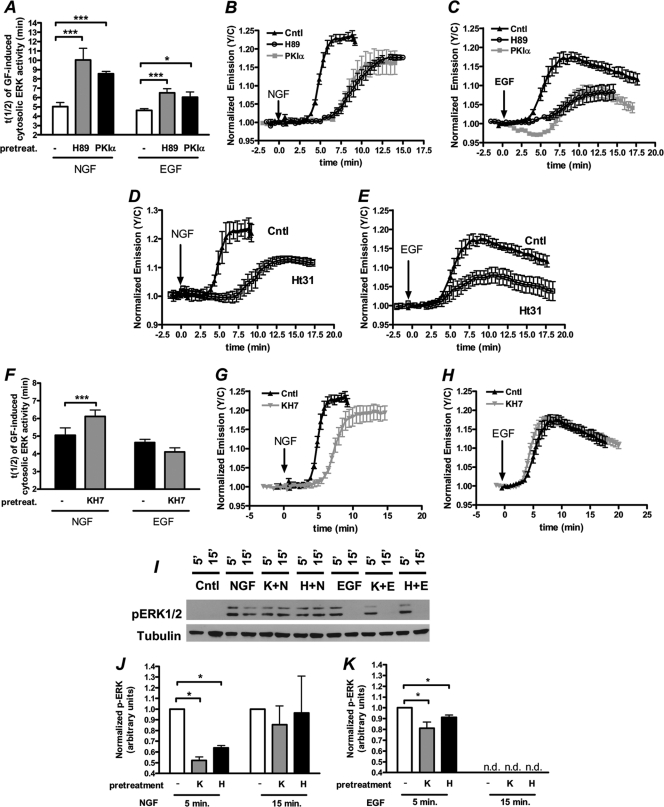
Fig. 4.
cAMP-mediated signaling regulates ERK activity in PC12 cells. (A) Bar graph depicting the time to reach half-maximal activation [(t(1/2)] of EKARcyto in response to various treatments (NGF alone [n = 12], NGF after H89 pretreatment [n = 14], NGF in the presence of PKIα expression [n = 5], EGF alone [n = 23], EGF after H89 pretreatment [n = 13], and EGF in the presence of PKIα expression [n = 5]). (B) Time courses of PC12 cells expressing EKARcyto treated with NGF (Cntl; n = 8), NGF after 10 μM H89 pretreatment (n = 7), or NGF in the presence of PKIα expression (n = 5). (C) Time courses depicting the EKARcyto response to EGF (cntl; n = 8), EGF after H89 pretreatment (n = 4), and EGF in the presence of PKIα expression (n = 3). (D and E) NGF (D)- and EGF (E)-induced time courses of ERK activity in cells in which PKA anchoring was disrupted via pretreatment with Ht31 (1 μM). (F) Bar graph depicting the time to reach half-maximal activation of EKARcyto in response to various treatments (NGF alone [n = 12], NGF after KH7 pretreatment [n = 14], EGF alone [n = 23], and EGF after KH7 pretreatment [n = 13]). (G) Time courses of PC12 cells expressing EKARcyto treated with NGF (Cntl; n = 8) or NGF after 30 μM KH7 pretreatment (n = 7). (H) Time courses depicting the EKARcyto response to EGF (Cntl; n = 8) and EGF after KH7 pretreatment (n = 7). (I) PC12 cells were pretreated with vehicle, 30 μM KH7 (K), or 10 μM H89 (H) for 20 min and subsequently treated with NGF (N) or EGF (E) for 5 min or 15 min. Control cells (Cntl) were treated with vehicle only. Immunoblots of p-ERK1/2 and tubulin (loading control) represent a single experiment. (J) Quantifications of p-ERK1/2 over tubulin for the NGF-treated samples are plotted and normalized to the vehicle-treated sample at each time point (n = 3 to 5 independent experiments). (K) Quantifications of p-ERK1/2 over tubulin for the EGF-treated samples are plotted and normalized to the vehicle-treated sample at each time point (n = 3 to 5 independent experiments). All imaging and immunoblot data are shown as means ± SEMs. *, P < 0.05; **, P < 0.01; ***, P < 0.001; n.d., not detected.

