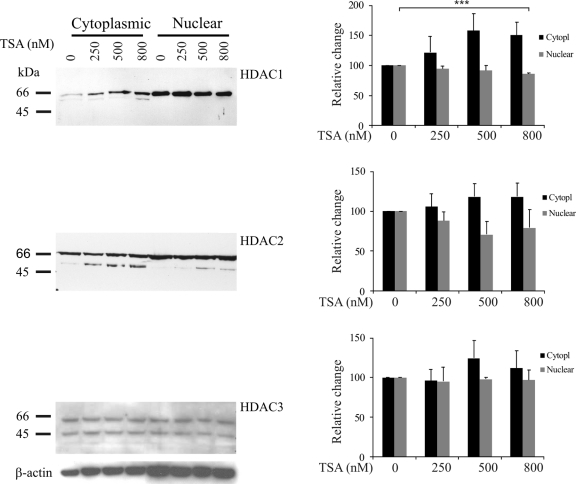
Fig. 1.
Effect of TSA treatment on expression and subcellular localization of different HDACs. Hep3B cells were treated with different concentrations of TSA for 24 h. Cells were harvested, cytoplasmic and nuclear proteins were separated on SDS-PAGE gels, and HDACs were detected by Western blotting. The graphs show the average of triplicate experiments, with error bars denoting standard errors of the means. Significance was calculated with a Student's t test. ***, P < 0.001.

