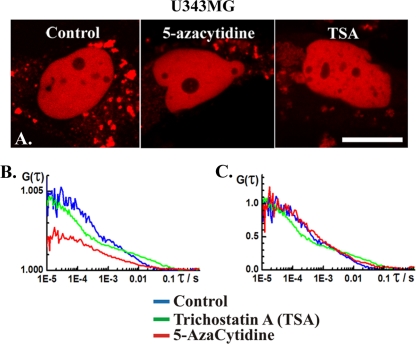
Fig. 8.
(A) CLSM images showing nuclear localization of DNMT1-RFP in human glioblastoma U343MG cells not treated (control) and treated with 5 μM 5-azacytidine or 500 nM TSA. Scale bar, 15 μm. (B) Autocorrelation curves recorded in the nucleus of untreated cells (control) and in the nucleoplasm (dark spots) in cells treated with 5-azacytidine and TSA. (C) Autocorrelation curves shown in panel B normalized to the same amplitude.

