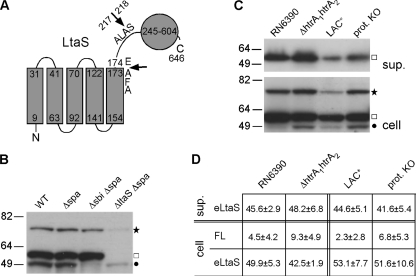
Fig. 1.
LtaS protein and its processing in defined S. aureus protease mutant strains. (A) Predicted membrane topology of S. aureus LtaS. The LtaS protein contains 5 N-terminal TM helices (5TM domain) followed by a 44-amino-acid linker region and the extracellular eLtaS domain. Residues 245 to 604 in the eLtaS fragment align with the PF00884 sulfatase domain, and proposed processing sites are indicated with arrows. (B and C) LtaS protein detection by Western blotting. (B) Strains RN4220 (WT), SEJ1 (Δspa), SEJ1 Δsbi (Δsbi Δspa), and 4S5 (ΔltaS Δspa) were grown to mid-log phase, and cell fractions were prepared and analyzed by Western blotting using a rabbit polyclonal antibody raised against the eLtaS domain. Full-length LtaS- and eLtaS-specific bands are indicated to the right of the panel, with a star and a square, respectively. Note that two unspecific bands are present in the ΔltaS lane. The faint top band is of the same mobility as the full-length LtaS band, and the bottom band is the Sbi protein and is annotated with a filled circle. Sizes of protein standards are given in kDa on the left. (C) S. aureus strain RN6390 and the isogenic mutant strain RN6390 htrA1 htrA2, as well as S. aureus strain LAC* and the isogenic strain LAC* Δaur ΔsspAB ΔscpA spl::erm (prot. KO), were grown to mid-log phase, and equal amounts of supernatant (sup.) and cell fractions were analyzed by Western blotting using LtaS antibody. Full-length LtaS is indicated with a star, eLtaS with a square, and the unspecific Sbi protein with a filled circle. (D) Densitometry analysis. The amounts of the three different LtaS-specific bands (cleaved eLtaS in the supernatant fraction, full-length LtaS in the cell fraction [FL], and cleaved eLtaS in the cell fraction) were quantified by densitometry. The total amount of LtaS protein was set to 100% for each strain, and % values for the three different fractions were calculated. The experiment was performed in triplicate, and the average % values and standard deviations are shown. Two-tailed two-value equal-variance Student's t test was performed, and no statistically significant differences were detected.

