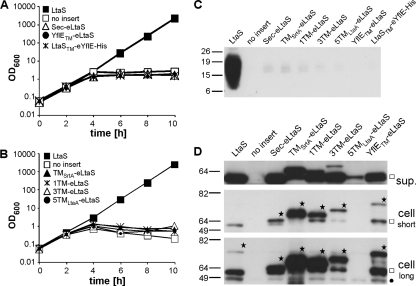
Fig. 5.
Complementation of growth and LTA production upon expression of different fusion proteins. (A and B) Bacterial growth curves. The fusion proteins indicated in the legend and depicted in Fig. 4 were expressed in S. aureus strain ANG499 by the addition of Atet after removal of IPTG. A strain expressing WT LtaS served as a positive control, and a strain containing the empty pitet vector (no insert) served as a negative control. Bacterial growth was monitored by determining OD600 readings at the indicated time points. All cultures were back diluted 1:100 at the 4-h time point, and the culture with the WT LtaS-expressing control strain was back diluted a second time at the 8-h time point, to maintain the cultures in the logarithmic growth phase. LTA (C) and LtaS protein (D) were detected by Western blotting. At the 4-h time point, 1-ml aliquots were removed from the S. aureus cultures described above, LTA in the cell-associated fraction was detected using an LTA-specific antibody, and the LtaS protein in the supernatant (sup.) and cell fractions was detected using the LtaS-specific antibody. Proteins expressed are indicated above each lane, and the assumed full-length LtaS fusion proteins are indicated with stars. The cleaved eLtaS fragments and the unspecific Sbi protein band are indicated by a square and a filled circle, respectively. Note that two different exposure times (short and long) are shown for the cell fraction sample in order to visualize the full-length wild-type LtaS protein. Exposure times and protein loading differed between supernatant and cell samples and are therefore not comparable with each other. S. aureus strains ANG513, ANG514, ANG595, ANG1217, ANG1218 ANG1219, ANG1220, ANG1347, and ANG1346 were used for this experiment.

