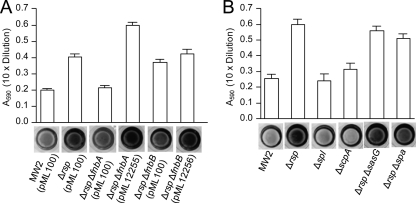
Fig. 6.
Biofilm assay in 96-well microtiter plates. Graphs represent the average absorbance of the eluted crystal violet dye from the stained wells, of which a representative well is shown below the graph. (A) Effect of ΔfnbA and ΔfnbB deletions on biofilm in the MW2 Δrsp background. Biofilm medium was supplemented with 5 μg/ml of chloramphenicol. Plasmids pML12255 and pML12256 carry MW2 fnbA and fnbB genes in pML100, respectively. Error bars indicate standard errors from 4 independent experiments. Student t test: MW2 Δrsp (pML100) versus MW2 Δrsp ΔfnbA (pML100), P < 0.0001; MW2 Δrsp (pML100) versus MW2 Δrsp ΔfnbB (pML100), P = 0.8308. (B) Effect of Δspl and ΔscpA in MW2 background and effect of ΔsasG and Δspa in the MW2 Δrsp background. Error bars indicate standard errors from 3 independent experiments. Student t test: MW2 Δrsp versus MW2 Δrsp Δspa, P = 0.031.

