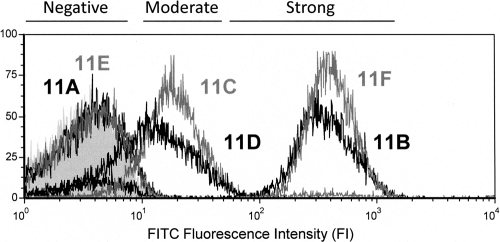
Fig. 2.
Staining intensity curves fall into three categories according to FCSA. Flow cytometry histogram displaying the fluorescence intensity (FI) curves of factor serum 11g binding to all serogroup 11 serotypes. Serotypes yielding each binding curve are matched by shade next to their corresponding curves. The gray-filled curve corresponds to serotype 11B stained with secondary antibody only (negative control). Bands above the diagram depict the FI ranges corresponding to signal grading.

