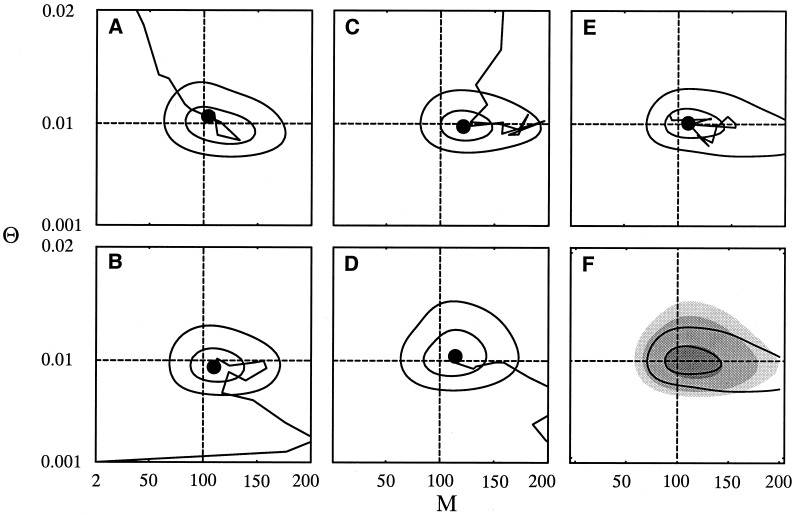
Figure 3.
Convergence of parameter estimates in migrate. Four runs by using different initial parameter settings in migrate: (A) Θ0 = 0.1 and ℳ0 = 2, (B) 0.001 and 2, (C) 0.1 and 200, (D) 0.001 and 200. E shows run that was started with values from an FST-based method with Θ0 = 0.0097 and M0 = 97. F compares the average surface of A–D with E. In A–E, the line marks the trajectory of the parameter estimates over successive chains to the final estimate (black disk). Solid contour lines depict approximate 50 and 95% likelihood-based confidence regions. Gray-scale contour areas are from dark to light, 50, 95, 99% confidence regions of the average of A–D. The data set was generated by using Θ = 0.01 and M = 100 (dashed lines).

