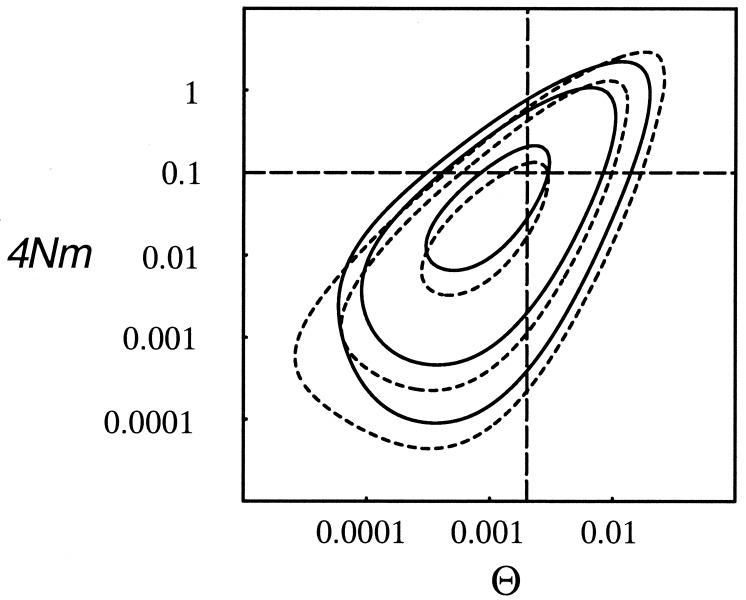
Figure 4.
Comparison between results from migrate and genetree. The logarithm likelihood contours inferred by migrate are drawn with solid lines, and those inferred by genetree with broken lines. Contour lines enclose approximate 50, 95, and 99% likelihood-based confidence regions. The dashed lines mark the true parameter values used to generate the data set.

