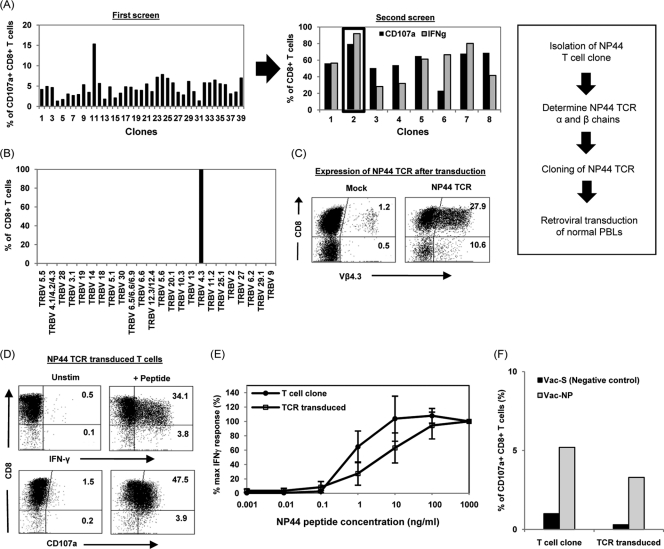
Fig. 3.
Production of SARS-specific TCR-redirected T cells. (A) Isolation of NP44-specific T cell clone. NP44-specific CD8+ T cells were purified by FACS and cloned by limiting dilution assay. Clonal populations were expanded and subjected to two rounds of screening for CD107a+ and/or IFN-γ+ CD8+ T cells. (B) Determination of the TCR β chain of the NP44-specific T cell clone by staining for the various TCR β variable regions (TRBV). The percentages of the CD8+ T cells positive for the various TRBV are indicated. Further cloning of the TCR α and β chains of the T cell clone was carried out, and peripheral blood lymphocytes from a healthy donor were transduced with the SARS NP44 TCR retroviral vector. (C) Dot plot of Vβ4.3 expression in mock- or NP44-TCR transduced T cells from a representative healthy donor. The percentages of Vβ4.3+ T cells (CD8+ and CD8−) after gating on the CD3+ fraction of the PBMC are indicated in the upper and lower right quadrants. (D) Dot plot from representative SARS NP44-transduced T cells incubated with target cells loaded with NP44 peptide. The percentages of IFN-γ+ or CD107a+ T cells (CD8+ and CD8−) after gating on the CD3+ fraction of the PBMC are indicated in the upper and lower right quadrants. (E) For functional avidity, NP44-specific T cell clone or SARS NP44 TCR-transduced T cells were incubated with target cells pulsed with the indicated concentrations of NP44 peptide. The percent maximum IFN-γ+ response was plotted against the concentrations of NP44 peptide, whereby the maximum IFN-γ+ response at 1 μg/ml was set as 100%. The data shown are the mean values of three experiments with standard error bars as indicated. (F) For recognition of the endogenous SARS antigen, the SARS NP44-specific T cell clone and NP44 TCR-transduced T cells were incubated with target cells infected with a vaccinia virus construct expressing the SARS spike (S) (negative control) or nucleocapsid (NP) protein at an MOI of 5 and stained for CD107a. The percentages of CD107a+ cells in the total CD8+ population are shown.

