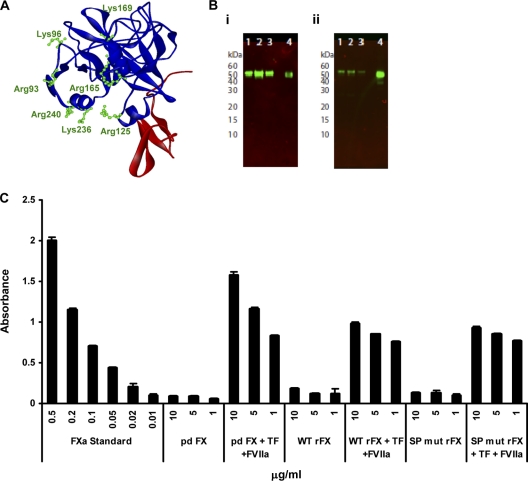
Fig. 1.
Validation of rFX protein. (A) Ribbon diagram of the FX serine protease-epidermal growth factor 2 (EGF2) domains (1HCG; Accelrys ViewerLite software) (10). SP is in blue, and EGF2 is in red. The diagram highlights amino acid residues (green) targeted for mutagenesis studies. (B) Western blot analysis of rFX was performed under nonreducing conditions (10% Bis-Tris mini gels; Novex), and rFX was probed with a primary monoclonal human anti-FX clone HX1 antibody (1:1,000 dilution) and a goat anti-mouse infrared (IR) dye (800CW)-labeled secondary antibody (LI-COR). The blot was visualized using an Odyssey infrared imaging system (LI-COR). (i) Lanes 1 to 3, SP mutant rFX purified by 4G3 column; lane 4, pd FX control. (ii) Lanes 1 to 3, WT rFX purified by 4G3 column; lane 4; pd FX control. (C) Activation of WT rFX and SP mutant rFX (SP mut rFX). The amidolytic activity of FXa was measured using 1 mM chromogenic substrate S-2765 (Quadratech, Surrey, United Kingdom) in the absence and presence of 100 nM tissue factor (TF), 100 nM factor VIIa (FV119), and 6 mM CaCl2. All measurements were determined kinetically at 405 nm. Error bars represent standard errors of the means (n = 3).

