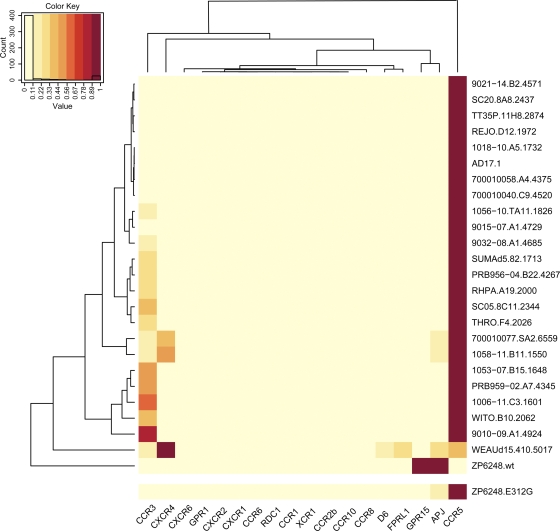
Fig. 6.
Comparison of the ZP6248 Env tropism to that of other subtype B T/F Envs. Entry of ZP6248.wt and ZP6248.E312G pseudotypes into 18 different NP-2 cell lines stably expressing CD4 and the indicated seven-transmembrane domain receptors was compared to that of 24 clade B T/F Envs. The cell line that was infected most efficiently for each virus was normalized to one (dark red), while the entry into the other cell lines was expressed as a fraction of this value as indicated by the key within the figure. Dendrograms on the top and left of the heat map represent hierarchical clustering of the data that show coreceptors with similar patterns of usage by Envs (top) and Envs with similar tropism for coreceptor usage (left).

