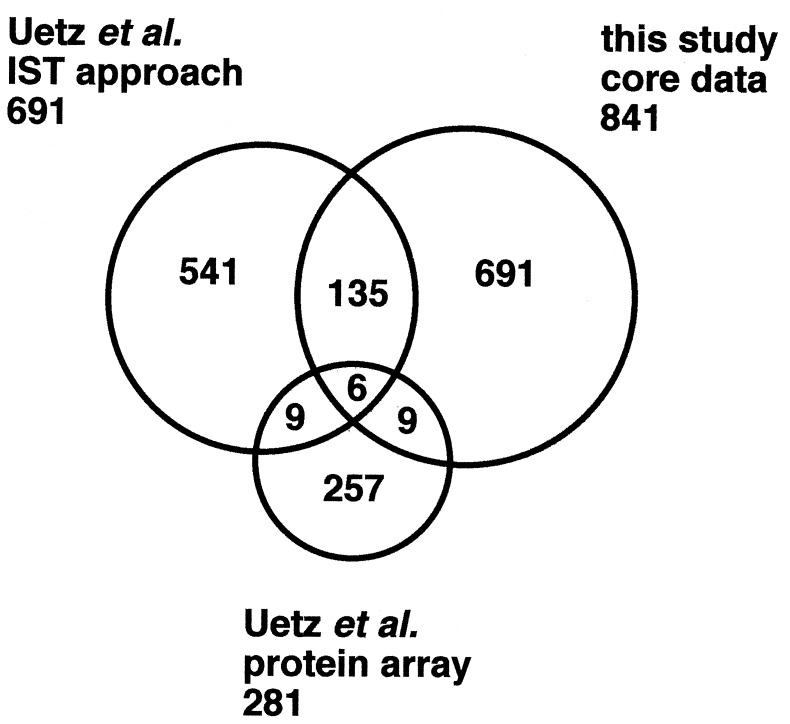
Figure 2.
Overlap among the results of large-scale two-hybrid projects. The Venn diagram indicates the overlap among the core data of our analysis and those obtained by the high-throughput IST analysis and the protein array approach by Uetz et al. (11).

