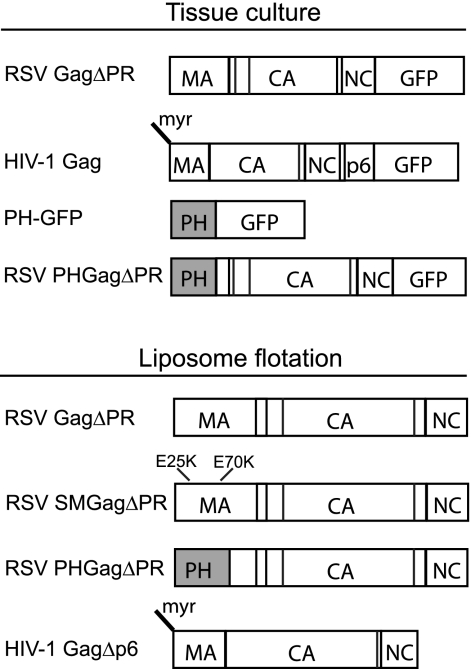
Fig. 1.
Schematic representations of proteins. RSV and HIV-1 GFP-tagged proteins expressed in transfected cells are shown at the top along with the PH-GFP protein. Proteins translated in vitro and submitted to flotation analysis are shown at the bottom. Vertical lines in the boxes stand for protease cleavage sites.

