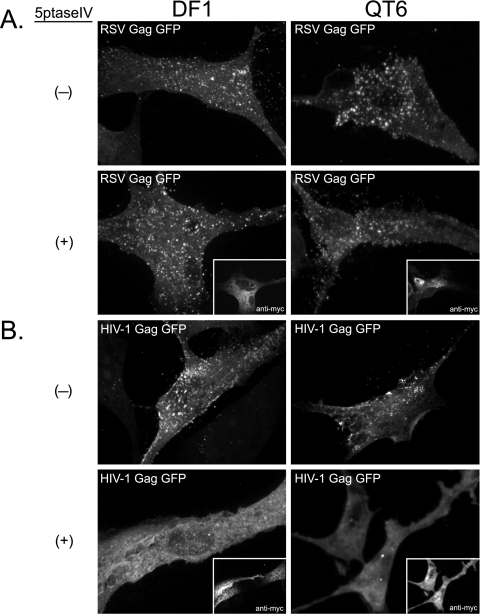
Fig. 3.
Effect of 5ptase on PM localization of RSV Gag-GFP and HIV-1 Gag-GFP. DF1 (left) or QT6 (right) cells were cotransfected with DNAs encoding either RSV Gag-GFP (A) or HIV-1 Gag-GFP (B) and a control plasmid (indicated by a minus sign) or a plasmid encoding myc-tagged 5ptase (indicated by a plus sign; myc signal shown in insets). Images are projections of 10 to 15 confocal sections from each cell compiled by average fluorescence intensity and indicate total cellular fluorescence. Images are representative for each condition (n > 30).

