Fig. 5.
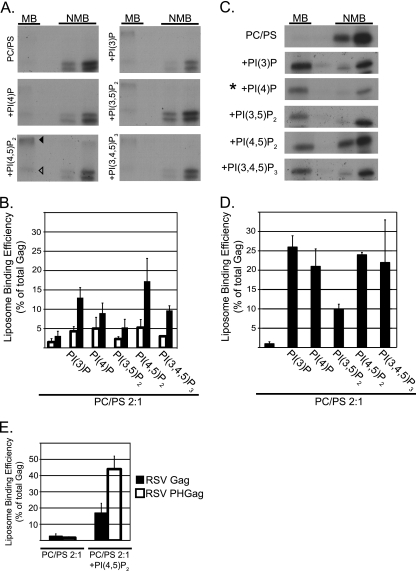
Flotation analysis of RSV Gag and HIV-1 Gag binding to PC/PS and PC/PS/PIP liposomes. All liposomes were PC/PS (2:1) without or with (+) the addition of 7.25% PIPs. (A and C) Representative flotation results for RSV Gag and HIV-1 Gag, respectively. MB, membrane bound (floated liposomes); NMB, not membrane bound. The RSV autoradiograms show the Gag band (open triangle) and a higher-molecular-weight band (filled triangle), which was consistently observed in the presence of liposomes containing PIPs. In C, the asterisk indicates that one-fourth of the total was used for the NMB samples. (B and D) Quantification of three or more flotation reactions for each liposome composition. The RSV quantification includes values for the Gag band only (open bars) or the Gag band plus higher-molecular-weight bands (filled bars). (E) Quantification of RSV PHGag and RSV Gag (data taken from Fig. 5D). Error bars represent standard deviations from the mean.

