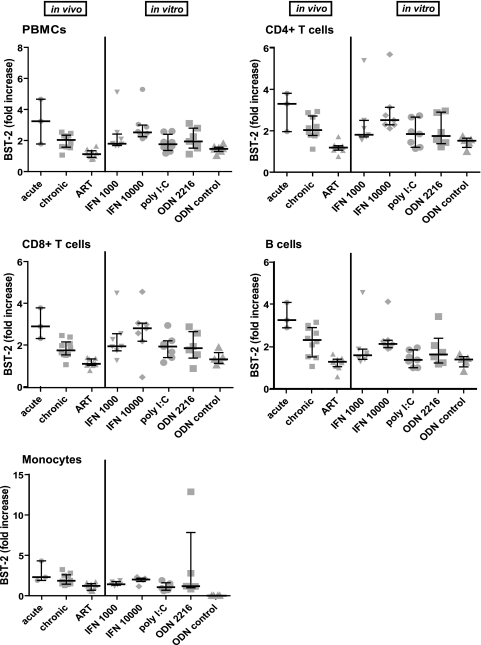
Fig. 5.
Cells stimulated in vitro with interferon or TLR agonists display comparable induction of BST-2 as is observed in vivo during HIV infection. Fold increase of BST-2 cell surface levels on frozen, infected PBMCs (in vivo) versus those on fresh, PHA/IL-2-activated PBMCs treated (in vitro) with the indicated IFN-α (1,000 and 10,000 U/ml) and TLR agonists [poly(I·C) LMW and ODN2216, n = 7 donors] for 24 h before analysis by flow cytometry. Shown are single values (symbols), median values (horizontal line) and the interquartile range of fold increase in BST-2 mean fluorescence intensity (MFI) relative to that of uninfected or unstimulated cells.

