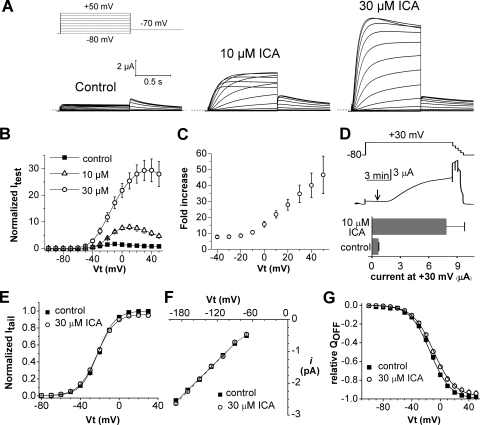
Fig. 1.
Voltage-dependent activation of hERG1 current by ICA-105574 (ICA) in X. laevis oocytes. A, ICA increases the magnitude of hERG1 current. Currents were elicited with 1-s pulses to test potentials applied in 10-mV increments from −80 to +50 mV. Tail currents (Itail) were measured at −70 mV. Voltage protocol is shown above control current traces. B, I-Vt relationships measured before (control) and in presence of 10 and 30 μM ICA (n = 3–8). Currents were normalized relative to the peak outward control current at +20 mV. C, fold increase in normalized peak outward current induced by 30 μM ICA plotted as a function of Vt (n = 8). D, ICA binds to open/inactivated state of hERG1 channels. Top, voltage-clamp protocol. Middle, corresponding current trace showing time of application of 10 μM ICA (arrow). After several minutes at +30 mV, the voltage was progressively stepped down from 0 to −80 mV in 20-mV increments. Bottom, plot of current magnitude at +30 mV before (control) and after 10 min in the presence of 10 μM ICA (n = 4). E, plot of peak Itail versus Vt determined before and after 30 μM ICA in oocytes bathed in 104 mM [K+]e solution. Currents were activated with 1-s pulses to a variable Vt and Itail was measured at −140 mV. Peak Itail magnitude was determined by fitting the current decay to a biexponential function and extrapolating the fit to the onset of membrane repolarization then normalized relative to the peak of control Itail for each oocyte. Data were fitted with a Boltzmann function (smooth curves). For control, V0.5 = −22 ± 0.5 mV, k = 8.8 ± 0.3 mV; for ICA, V0.5 = −22.9 ± 0.3 mV, k = 9.3 ± 0.2 mV (n = 9). F, single-channel I-Vt relationship determined for cell-attached patches from oocytes bathed in control or 30 μM ICA solution. Slope conductance determined by linear fit of data for the Vt range of −100 to −180 mV was 18.1 ± 0.39 pS (n = 10) in control patches and 18.6 ± 0.28 pS (n = 10) in the presence of 30 μM ICA. G, ICA does not alter the voltage-dependence or maximal value of charge displacement (QOFF-max) associated with the OFF gating current of hERG1 channels. Normalized QOFF-max was plotted as a function of Vt and fitted with a Boltzmann function (smooth curves). For control, V0.5 = −14.0 ± 0.6 mV, k = 14.1 ± 0.3 mV; for ICA, V0.5 = −9.7 ± 0.1 mV, k = 14.7 ± 0.3 mV (n = 9). The slight shift in V0.5 was also observed for vehicle (DMSO) control (see Supplemental Fig. 1).

