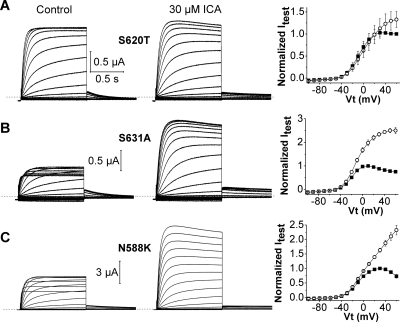
Fig. 2.
Mutant channels with impaired inactivation are less sensitive to ICA. A, S620T hERG1 currents recorded before (control) and after 30 μM ICA (left and middle). Currents were elicited as described in Fig. 1A. Right, plots of mean I-Vt relationships determined before (■) and after 30 μM ICA (○). Currents (Itest) were measured at the end of 1-s test pulses and normalized relative to the peak outward value of control currents (n = 7). B and C, current traces (left and middle) and I-Vt relationships (right) for S631A (n = 4) and N558K (n = 3) hERG1 channels.

