Fig. 1.
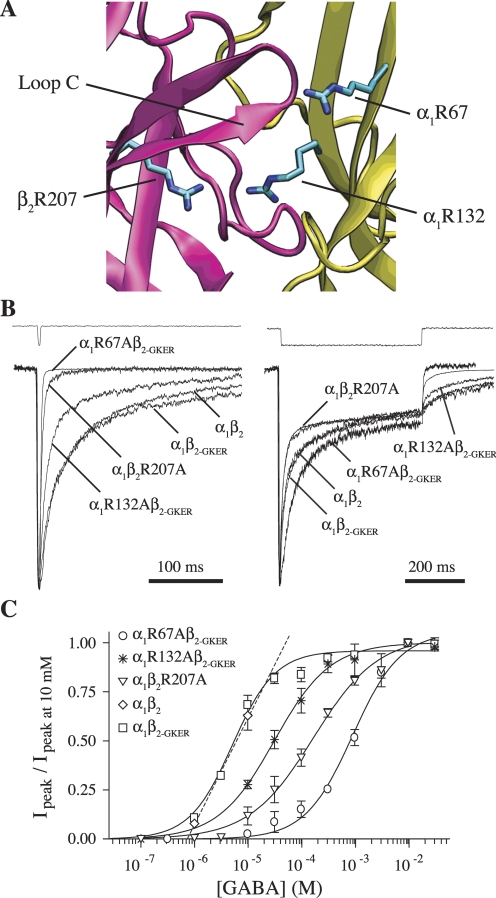
Mutation of β2Arg207, α1Arg67, or α1Arg132 to alanine increases the rate of deactivation and right-shifts concentration-response curves but does not affect desensitization. A, homology model of the GABAA receptor agonist binding site at the interface between β2 (pink) and α1 (yellow) subunits showing residues β2Arg207, α1Arg67, and α1Arg132 (O'Mara et al., 2005; with α1Arg67 rotated arbitrarily so as to protrude into the binding pocket). B, mutants and wild-type receptors were challenged with 2 to 4 ms (left) or 500 ms (right) pulses of 10 mM GABA (because of differences in EC50, we ensured saturation by using 30 mM GABA for R67A). All traces were normalized to their peak to ease comparison. Peak currents of traces shown varied between 60 and 300 pA. Each trace is the average of between 8 and 25 sweeps, recorded while the patches were held at −60 mV. The top traces in both are example recordings from open pipette tips at the end of an experiment to demonstrate solution exchange. C, GABA concentration-response curves of peak currents, fit with the equation IGABA/IGABA-max = Ymax/[(EC50/[GABA])N + 1], where N is the Hill coefficient (Prism 4). Only two data points are shown for α1β2, which were linearly interpolated to estimate EC50 (Table 2).

