
Figure 3.
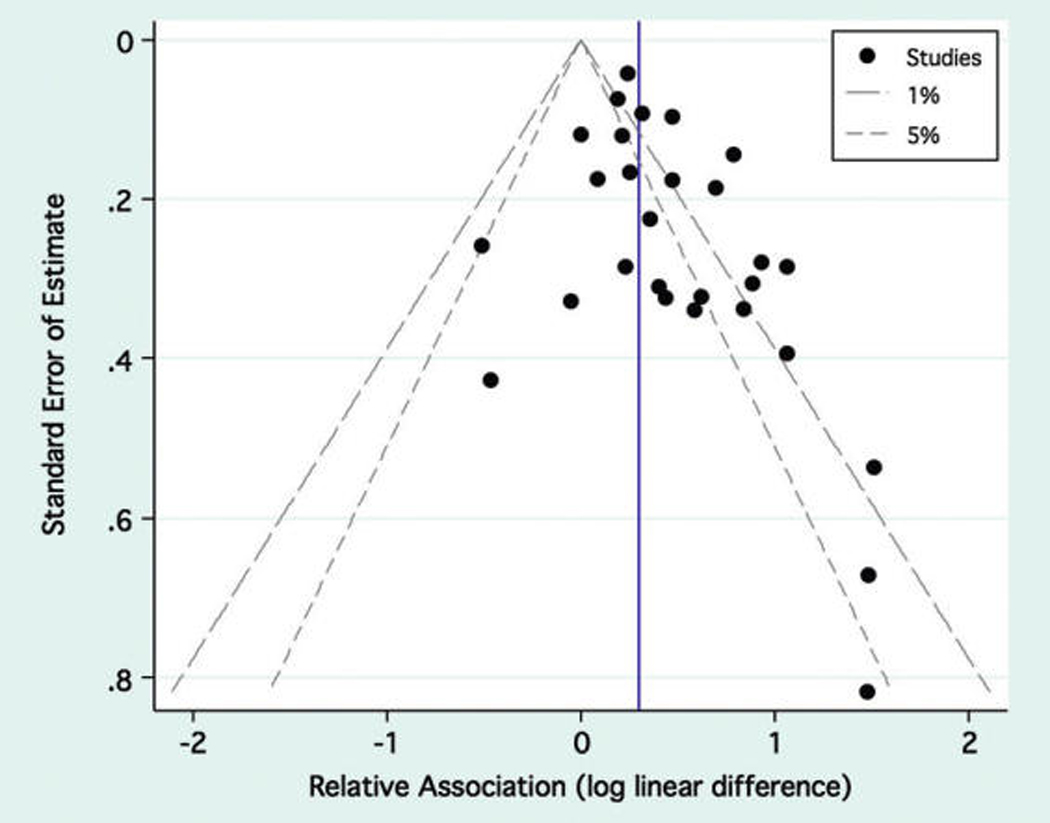
Precision versus strength funnel plot. The funnel plot depicts the study precision as a function of the strength of association. The outer borders of the funnel represent the required strength of association to obtain statistical significance at any given level of precision for a critical α for hypothesis tests of 1% or 5%. The vertical blue line represents the sOR for combining all 28 studies.