Figure 4.
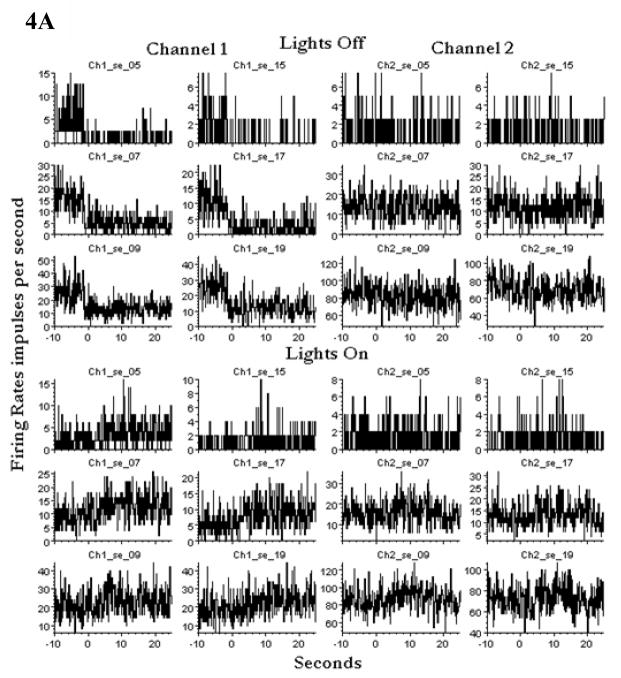
A: Room lights were turned off and on, and the averages of four episodes of each are presented here. The channel 1 units that did not change firing rates are omitted from the figure. Changes occurred in channel 1 but minimally in channel 2. Note the different abscissa values. Lowest firing units(40%)are omitted because their rates did not change. Day 1433. Subject ER.
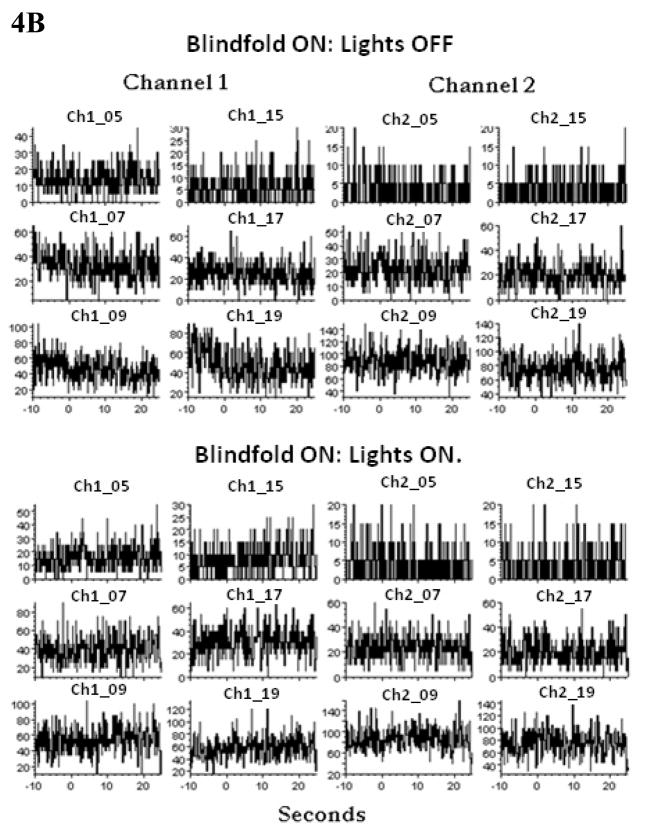
B. After the subject was blindfolded, the ambient and room lights were turned off and on, three times each and the averages are presented here. The same units that changed firing rates in the panel A above are presented here for comparison. Note the different Y axis values. The firing rates did not change defined as an increase (or decrease) that is twice (or half) the baseline. Day 1435. Subject ER. Again the lowest firing units are omitted (40%).
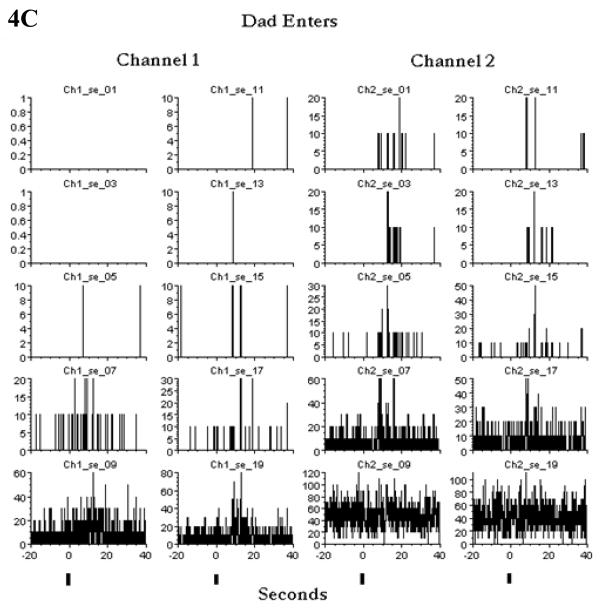
C: Channel 1 and channel 2 units on day 1431 produce increases in firing rates when his Dad enters the room. The increase occurs even in those units that usually do not fire at high rates. Unlike the data from day 1412 (figure 3), the channel 2 units are also involved on this day 1431. The vertical dash marks indicate the approximate time when his Dad enters the room. Day 1431. Subject ER. All units included because changes occurred in most units. Not all changes shown below were changes in state: Some were transient.


