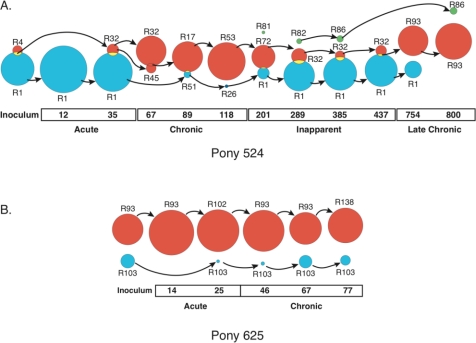
Figure 1.
Partition analysis identifies two co-existing sub-populations of rev variants [9]. The groups present at each time point were found using the program PAQ [9,12]. The relative size of each group represents the proportion of the population contained within the group at that time point. The central Rev variant for each group is shown, and the arrows show from which group the central variant likely evolved. Groups that overlap indicate that both groups share at least one variant. The different groups are designated Group 1 (red), Group 2 (blue), and Group 3 (green). The day post-infection and clinical stages of infection are indicated. (A) Partition analysis of pony 524 rev nucleotide variants at sequential times following infection. (B) Partition analysis of pony 625 rev nucleotide variants at sequential times following infection.

