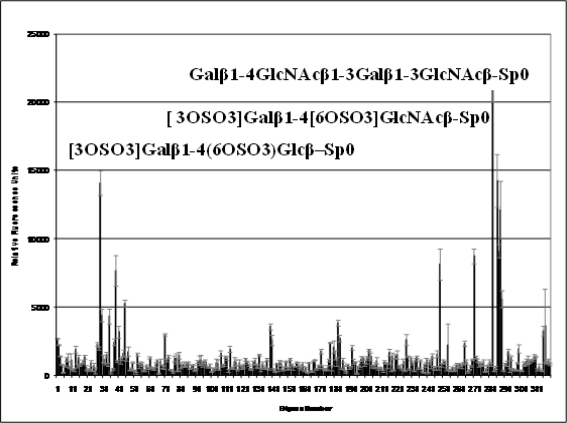
Figure 3.
Glycan array analysis of VP2 binding. Version 3.0 of the printed array of the Consortium for Functional Glycomics was probed with VP2 (200 μg/ml). Error bars represent the mean ± standard error of four replicates. Glycans yielding significant binding are shown with their numbers and names.

