
Figure 1.
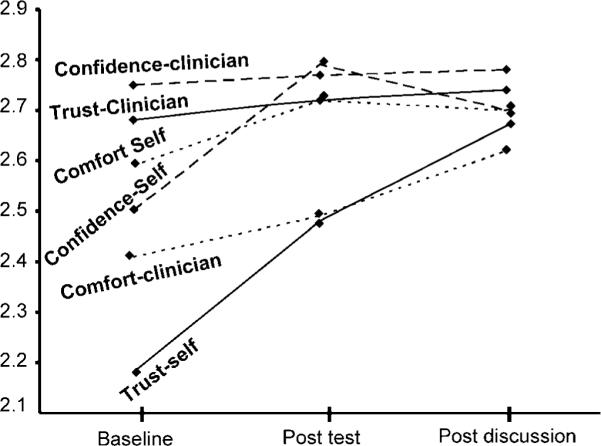
Change in three acceptability subscales for self-testing and three subscales for clinician testing over time. The Y-axis is the mean scale score (range 1–3) (the subscale `perceived effects of testing' did not change by time or rater, and is not displayed to improve readability).