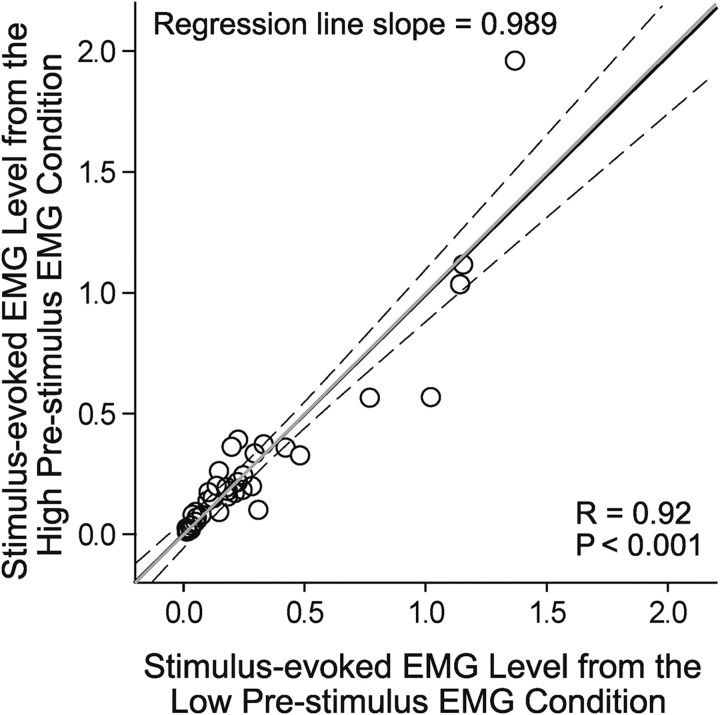
Figure 3.
Relationship between RL-ICMS-evoked mean EMG levels at two different starting hand positions for 41 cortical site–muscle pairs that produced opposing effects on EMG activity. The black line is the linear regression line. Dotted lines are 95% confidence intervals. The gray line has a slope = 1. The regression line slope, correlation coefficient (R), and p value are given. EMG activity is in arbitrary units.

