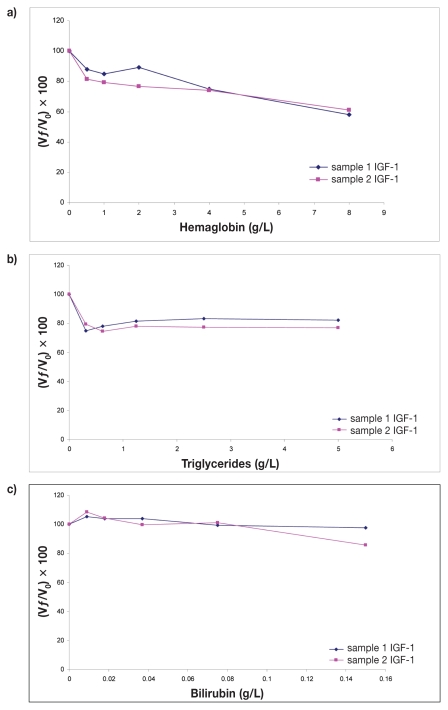
Figure 2.
Interferograms corresponding to the effect of hemoglobin (a), triglycerides (b), and bilirubin (c) concentrations on insulin-like growth factor (IGF-1) determination by assay (IMMULITE 1000). Y-axes show percentage of change in IGF-1 [(Vƒ/V0) × 100] for a given concentration of hemoglobin, triglycerides, or bilirubin, respectively. Vƒ, final value; V0, original value.

