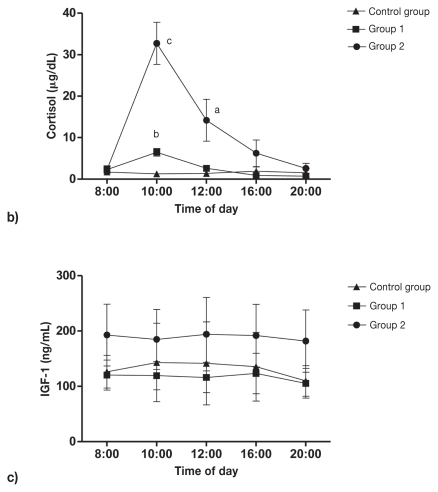
Figure 4.
Mean ± standard deviation plasma cortisol (a) and insulin-like growth factor (IGF-1) (b) response to subcutaneous (SC) bolus of methylprednisolone: 1 mg/kg BW (group 1; n = 5) and 5 mg/kg BW (group 2; n = 5). Four dogs in the control group were injected SC 0.9% NaCl (0.1 mL/kg). a Statistically significant (P < 0.01). b Statistically significant (P < 0.001). c Statistically significant (P < 0.0005).

