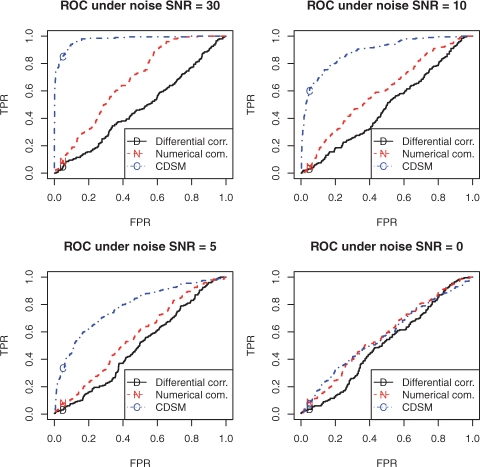
Fig. 3.
The advantage of CDSM on detecting conserved and differential interactions when network architecture is not given, in contrast to numerical comparison and differential correlation. In the figures, TPR, the true positive rate, is the ratio of detected true differential interactions to total true differential ones; and FPR, the false positive rate, stands for the ratio of falsely detected differential interactions to total true conserved ones. The closer to the top-left corner an ROC is, the better the performance. The diagonal line stands for the performance of random guessing. For all noise levels, CDSM achieved the best performance among the three methods.

