
Figure 4.
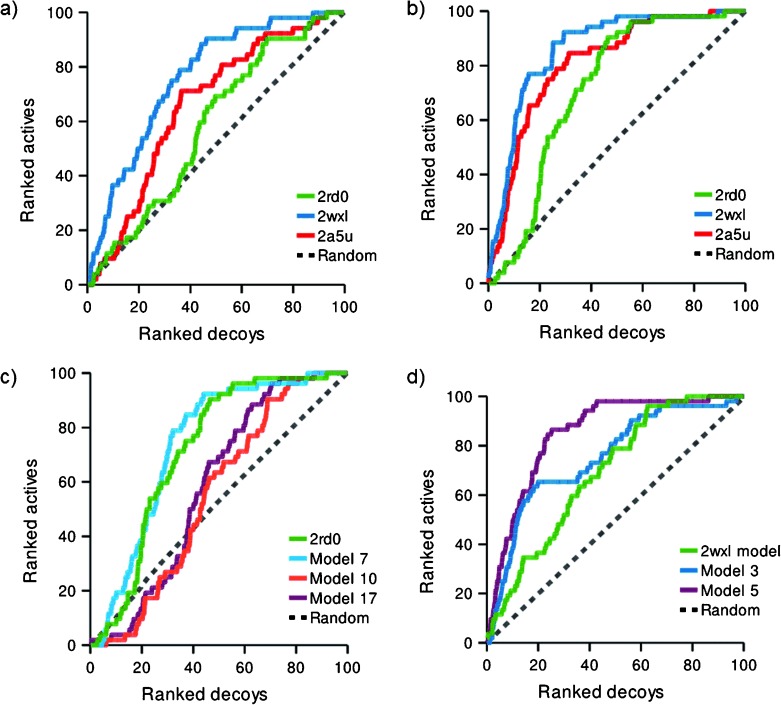
ROC curves for docked ligands and decoy compounds based upon PI3Kα IC50 data. The dotted line shows the expected result if there is no enrichment. a) Deprotonated and b) protonated ligands docked into PI3K crystal structures: PI3Kα (2RD0), PI3Kγ (2A5U) and PI3Kδ (2WXL). c) Docking into induced fit poses generated from the apo-PI3Kα structure 2RD0 using protonated ligands. d) Docking into induced fit poses for PI3Kα homology models derived from the ligand-bound PI3Kδ structure (2WXL) using protonated ligands.