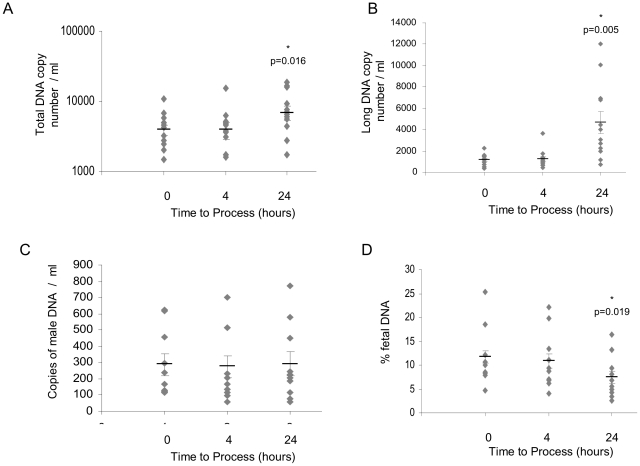
Figure 2. Samples processed at 0, 4, and 24 hours, stored at 4°C.
(A) Total DNA copy number per ml of plasma, (B) long DNA copy number per ml of plasma; n = 12. (C) Male DNA copy number per ml of plasma, and (D) percentage of fetal DNA; n = 10. Mean for each set of data is represented by a black bar, SEM is indicated, *indicates statistical significance.

