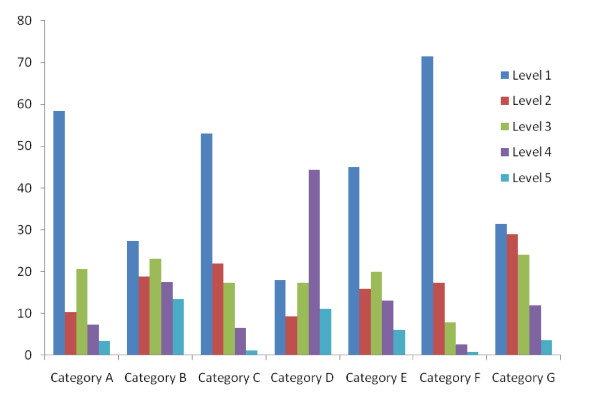
Figure 1.
This is a graphic representation of the qualitative analysis of the students' self-reflective documents. The y-axis shows the percentage of student responses in the various levels of reflection to the various categories as listed on the x-axis. Level 1 indicates a limited reflection-awareness while level 5 represents a well-reflected response. The categories on the x-axis are as follows: Category A: Significant events from course that led to reflection. Category B: Information/Skills acquired from course. Category C: Personal abilities. Category D: Personal learning style. Category E: Connections between the course and past life experiences. Category F: Oneself in relation to the situation (emotions, values, beliefs, etc.).

