
Figure 6.
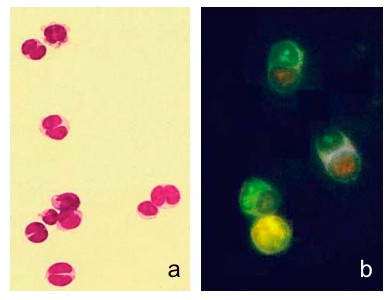
(a) Cell fusion products isolated by velocity sedimentation (fraction III) and stained by May-Grünwald Giemsa (400×) after cytocentrifugation, and (b) observed, in vivo, by fluorescence microscopy (500×) using a dual filter (485/515 nm and 578/610 nm) Cell tracker green (CMFDA) and orange (CMTMR) can still be observed after fusion; a yellow fluorescence develops only after cytoplasmic mixing.