Figure 3.
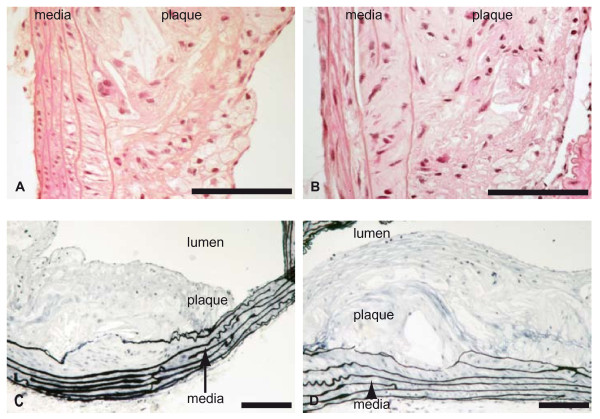
Atherosclerosis in Ldlr-/- (panels A and C) and Plin-/- Ldlr-/- (panels B and D) mice. Haematoxylin-eosin (panels A and B) and Verhoeff (panels C and D) stainings were performed on paraffin sections of aortas. Representative sections of atheroma plaques are shown. Magnification: ×10 (Ve rhoeff) ×20 (Haematoxylin-eosin). Scale: 100 μm.

