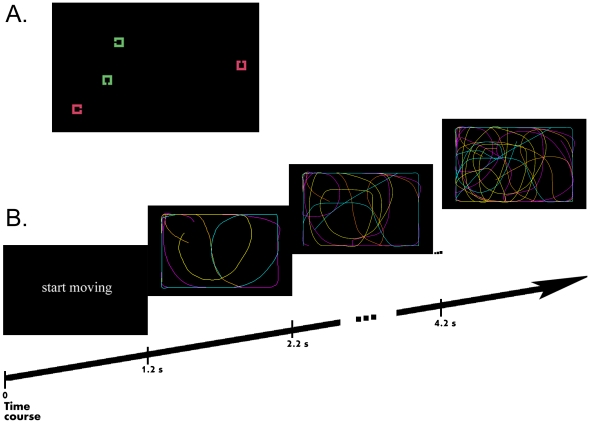
Figure 2. Schematic representation of the sequence of events during a sample trial.
A. Sample set-size 4 display. The participants' task was to identify the color of a target stimulus defined for each participant by the position of the gap in its outline. In the example, the target is defined as the square with a gap on the left side. The stimuli in this figure are larger than the actual stimuli. All stimuli were in constant motion throughout the trial. B. Color lines illustrate the motion paths of the stimuli (and were therefore not present in the displays). Note multiple regions of convergence of motion paths, making the visual search task difficult. The yellow line represents the path of the motion controlled by the participant. The other lines represent pre-recorded motion paths.

