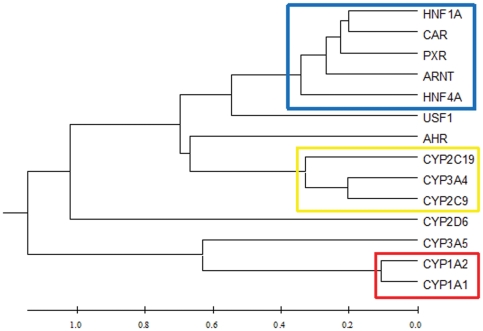
Figure 2. A UPGMA tree showing the relationships between 14 genes based on expression levels.
Spearman's correlation coefficients between the mRNA levels of seven P450s and seven regulator genes were identified using SPSS15.0. A distance matrix was constructed from the negative natural logarithm of the absolute value of the correlation coefficient, and the UPGMA tree was constructed from this distance matrix with MEGA 4.0. Three clusters were well defined: one containing CYP1A1 and CYP1A2; one containing CYP2C9, CYP2C19 and CYP3A4 and one containing HNF4A, HNF1A, ARNT, PXR and CAR.

