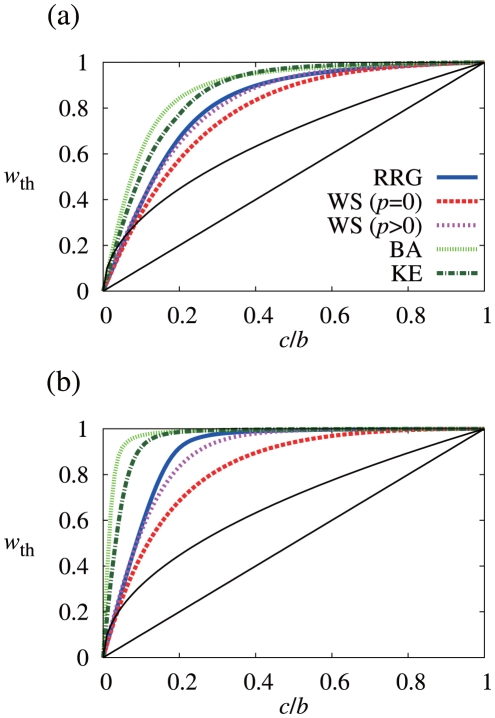
Figure 2. Relationship between threshold discount factor ( ) and cost-to-benefit ratio (
 ).
).
I use the five types of networks and set (a)  ,
,  , and (b)
  ,
,  . The results for direct reciprocity (i.e.,
  ) and upstream reciprocity on the directed triangle (i.e.,
  ) are also shown by thin black lines for comparison. In (a), I set the rewiring probability for the WS model to
  and
and  . For the BA model, there are initially
  nodes (i.e., dyad), and the number of links that each added node has is set to
  . For my variant of the KE model, the initial number of nodes and the number of links that each added node has are set to
  , and an active node
  is deactivated with probability proportional to
  , where
  . After constructing the network based on the original KE model [34], I rewire fraction
  of randomly selected links to make the average distance small. In (b), I set
  and
and  for the WS model,
  for the BA model, and
  and
and  for the KE model.

