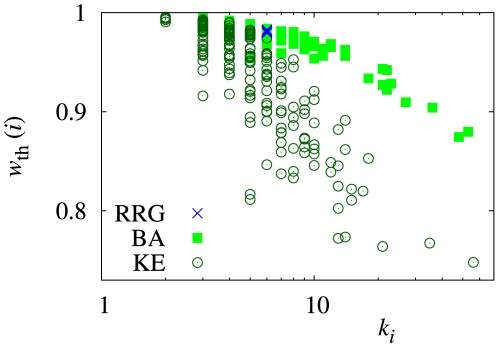
Figure 4. Relationship between threshold discount factor ( ) and node degree (
 ).
).
I use the RRG, the BA model, and the KE model with  and
and  , and set
  . The parameter values for the networks are the same as those used in Fig. 2(b).

