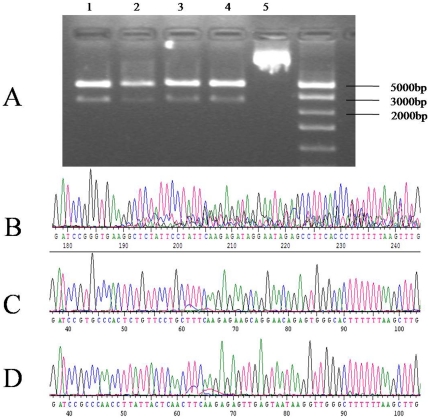
Figure 1. Restriction mapping and sequencing analysis.
Restriction mapping analysis shows (A) the pshRNA-1 (Lane 1), pshRNA-2 (Lane 2), pshRNA-3 (Lane 3), and pshRNA-negative (Lane 4), RNAi-Ready pSIREN-RetroQ-ZsGreen Vector (Lane 5) plasmids and sequencing of plasmids pshRNA-1 (B), pshRNA-2 (C), and pshRNA-3 (D).

