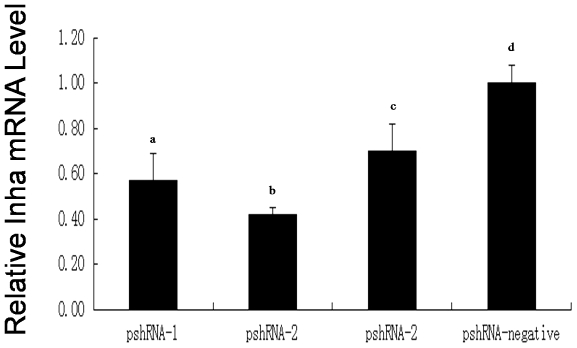
Figure 4. Inha mRNA expression in transfected cells.
The Inha mRNA levels in SCs transfected with RNAi recombinant plasmids pshRNA-1, pshRNA-2, pshRNA-3, or pshRNA-negative 48 h after transfection. Data are presented as the mean ± SEM (n = 3 in each group). For bars with different letters (a, d; b, d; c, d), the difference was significant (P<0.01).

