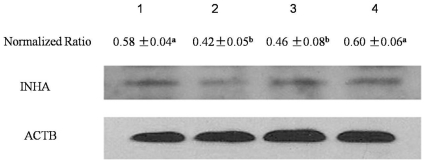
Figure 5. INHA protein levels in SCs.
Inha levels in SCs transfected with plasmids pshRNA-1, pshRNA-2, pshRNA-3, and pshRNA-negative 48 h after transfection. Lanes 1 to 4 represent the pshRNA-1, pshRNA-2, pshRNA-3, and pshRNA-negative plasmids, respectively. The normalized ratio for INHA was calculated by dividing the mean signal intensity for 3 biological replicates by the mean signal intensity with ACTB. Data are presented as the mean ± SEM, with different letters (a, b) was significant (P<0.05), as evaluated using Student's paired t test.

