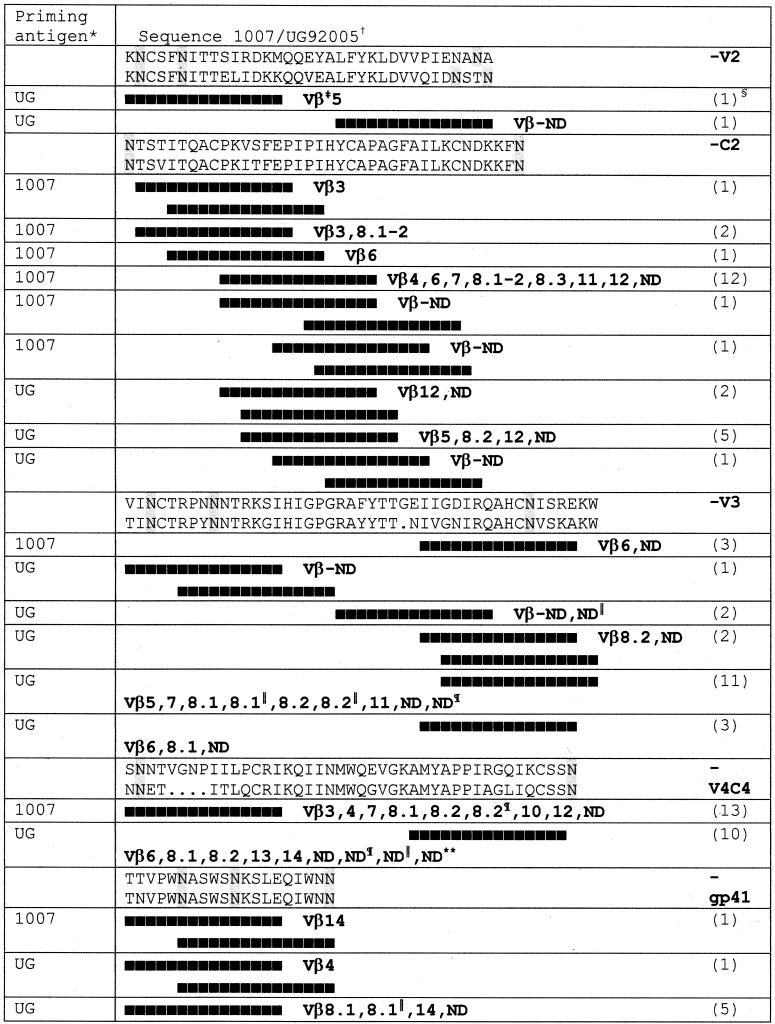
Table 1.
Th-epitope hotspots in the HIV env protein
Mice were immunized with either the 1007 or UG92005 (UG) envs using a prime and double boost regime.
Alignment of epitopes in sequences from the V2, V3, V4, C4 and GP41 regions of the 1007 (Upper) and UG (Lower) env sequences. The shaded residues identify potential sites for N-linked glycosylation. The black boxes show the precise location of the epitopes.
The spectrum of Vβ usage is shown for each hybridoma set, with ND designating TCRs that could not be identified with the available panel of mAbs.
The bracketed figures give the number of distinct clonotypes distinguished based on differences in peptide specificity, differences in TCR usage, or derivation from different mice. Positive IL-2 responses indicating peptide binding activity were approximately 1,280 units/ml, with backgrounds of 0–20 units/ml.
∥** Identify the Vα chains that could be characterized with the available mAbs to Vα2 (¶), Vα8 (∥), and Vα11 (**).

