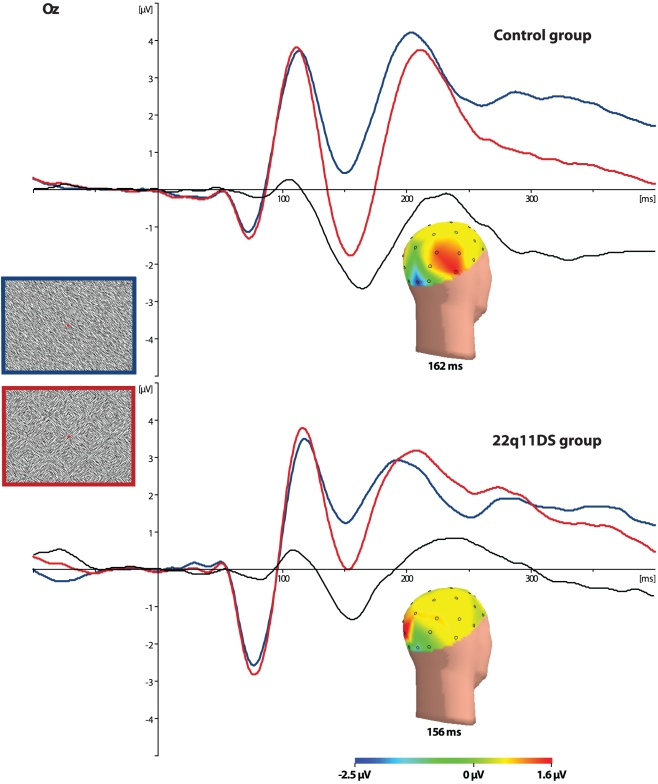
Figure 2. Event Related Potentials.
ERPs at Oz electrode representing responses to checkerboards (red lines), homogeneous stimuli (blue lines) and difference waves (black lines). The upper graph represents the control group, the lower graph the 22q11DS group. Voltage maps indicate differential activity between both stimuli at the peak of Oz texture negativity.

