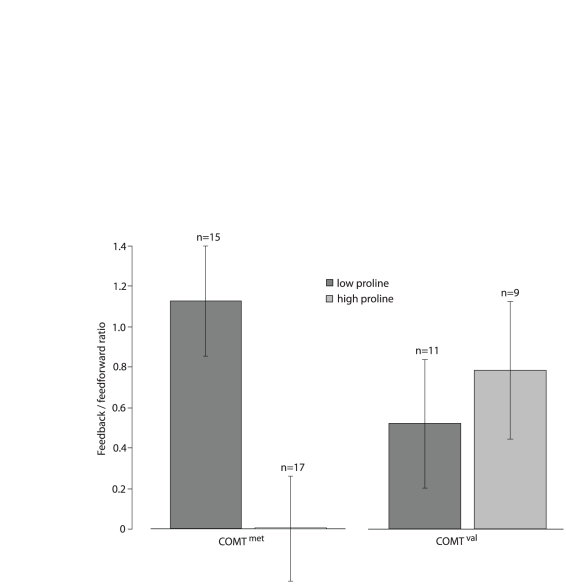
Figure 3. Feedback/feedforward ratio values.
The association between proline and feedback/feedforward ratio is moderated by the COMT 158 genotype. The COMT met subgroup is shown on the left, the COMT val subgroup on the right. Ratio values were calculated by dividing texture negativity amplitudes by C1 amplitudes. The 22q11DS group was further split into ‘high proline’ and ‘low proline’ subgroups, by means of the group median plasma proline value of 257 µM. The control group feedback/feedforward ratio value was 1.9 (SE .24).

