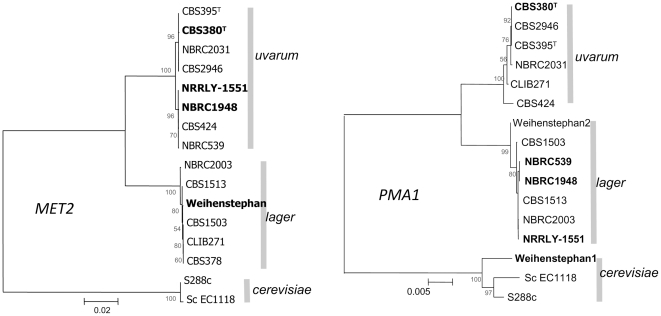
Figure 5. Evolutionary relationships of MET2 and PMA1 in mixed and pure lines.
The evolutionary history was inferred using the Neighbor-Joining method [55]. The optimal trees are shown (MET2: sum of branch length = 0.24619612; PMA1: sum of branch length = 0.09325799). Bootstrap values calculated on 100 replicates are shown next to the branches. A total of 1529 and 2847 nucleotides for MET2 and PMA1, respectively, were used in the final dataset. Two clusters are clearly separated showing their different origins. This underlines the hybrid nature of some S. bayanus strains: NRRL-Y1551, NBRC1948, NBRC539 and S. pastorianus Weihenstephan. S. cerevisiae sequences were used as outgroups.

