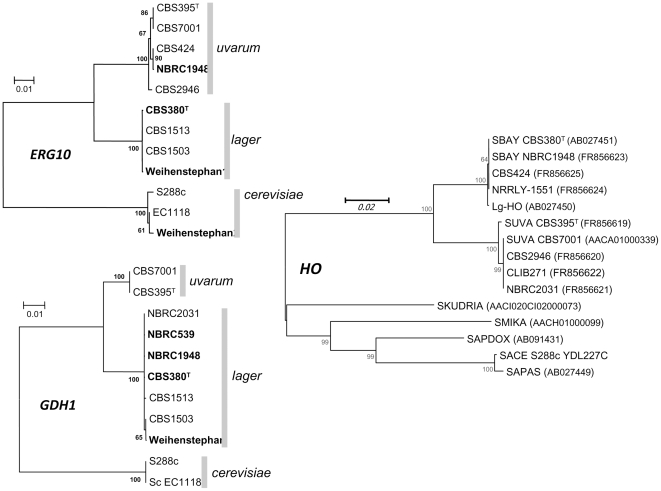
Figure 6. Evolutionary relationships of GDH1, ERG10 and HO in mixed and pure lines.
The evolutionary history was inferred as in Figure 5 but with limited number of strains analysed for GDH1, ERG10 and HO. Sequences GDH1 have been obtained in this study and from [5], ERG10 and HO are sequenced in this study except for bayanus-HO and Lg-HO. The optimal tree with the sum of branch length = 0.06421927 is shown. The percentages of replicate trees in which the associated taxa clustered together in the bootstrap test (100 replicates) are shown next to the branches. The tree is drawn to scale, with branch lengths in the same units as those of the evolutionary distances used to infer the phylogenetic tree. The evolutionary distances were computed using the Kimura 2-parameter method [61] and are in the units of the number of base substitutions per site. The analysis involved 44 nucleotide sequences. All ambiguous positions were removed for each sequence pair. There were a total of 4382 positions in the final dataset. Strain CBS 380T clustered in lager group based on ERG10 and GDH1 phylogenetic trees.

