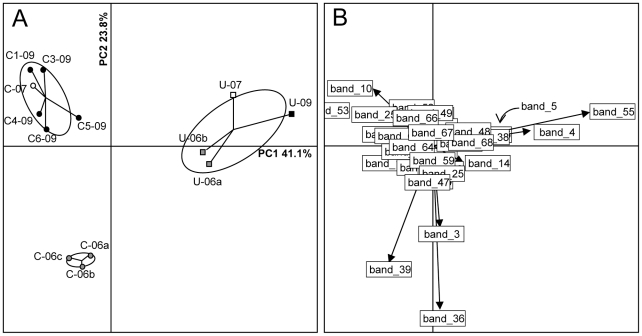
Figure 5. Principal Component Analysis of DGGE profiles from Villard soil samples.
(A) Individual sample projections on the first two axes of the analysis. The first axis (PC1) and the second axis (PC2) account for 41.1% and 23.8% of the variability, respectively. (B) Individual DGGE band projections on the first two axes. Band_5 position (masked by band_38) is indicated with an arrow. C corresponds to control samples, whereas U corresponds to uranium-rich samples. 06, 07 and 09 indicate the years 2006, 2007 and 2009 respectively. a,b,c correspond to replicates.

