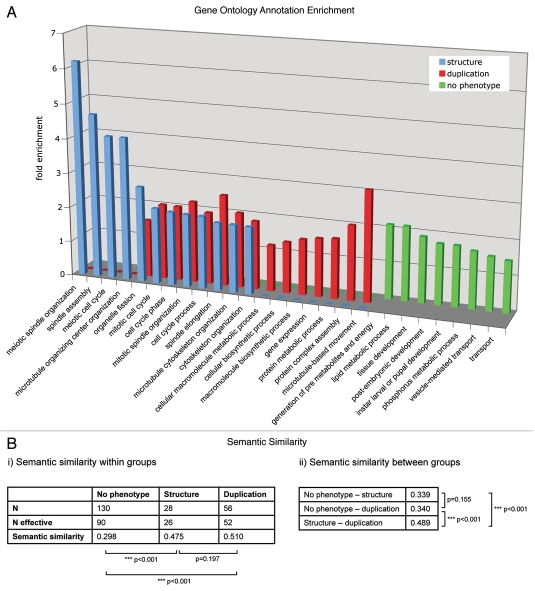
Figure 1.
(A) The enrichment of GO annotation terms (biological process level 3) in the phenotypic classes “centrosome duplication/separation.” “Centrosome structure” and “no phenotype” were analyzed using DAVID Functional Annotation Tool with the 251 MS-identified centrosomal candidate proteins as background. Bars indicate the fold enrichment of the respective GO terms in the phenotypic classes. (B) Semantic similarity scores (i) within and (ii) between the three protein sets. Scores were calculated with the Bioconductor package ‘GOSemSim’ (Version 1.8.2). N gives the total number of proteins, N effective gives the number of proteins with GO annotation sufficient for score calculation. p values for score differences were calculated using the Mann-Whitney U test.

